Category: Observability

  • How to Send AWS Logs into Cribl

    How to Send AWS Logs into Cribl

    Technical Best Practices for Extracting AWS Logs into Cribl

    Purpose

    To design a secure, scalable, and cost-optimized pipeline for extracting AWS log telemetry, transforming it into OpenTelemetry (OTLP) format, and routing it through Cribl Stream for delivery to multiple destinations.


    Why This Matters

    AWS logging services are powerful but often siloed within the AWS ecosystem. By integrating AWS-native log streams into Cribl, enterprises can:

    • Correlate AWS telemetry with other cloud, on-premises, and SaaS sources.
    • Apply in-stream optimization to reduce ingestion cost and improve analysis speed.
    • Enable multi-destination routing without reconfiguring AWS sources.

    Proposed Architecture


    AWS-Side Action Items

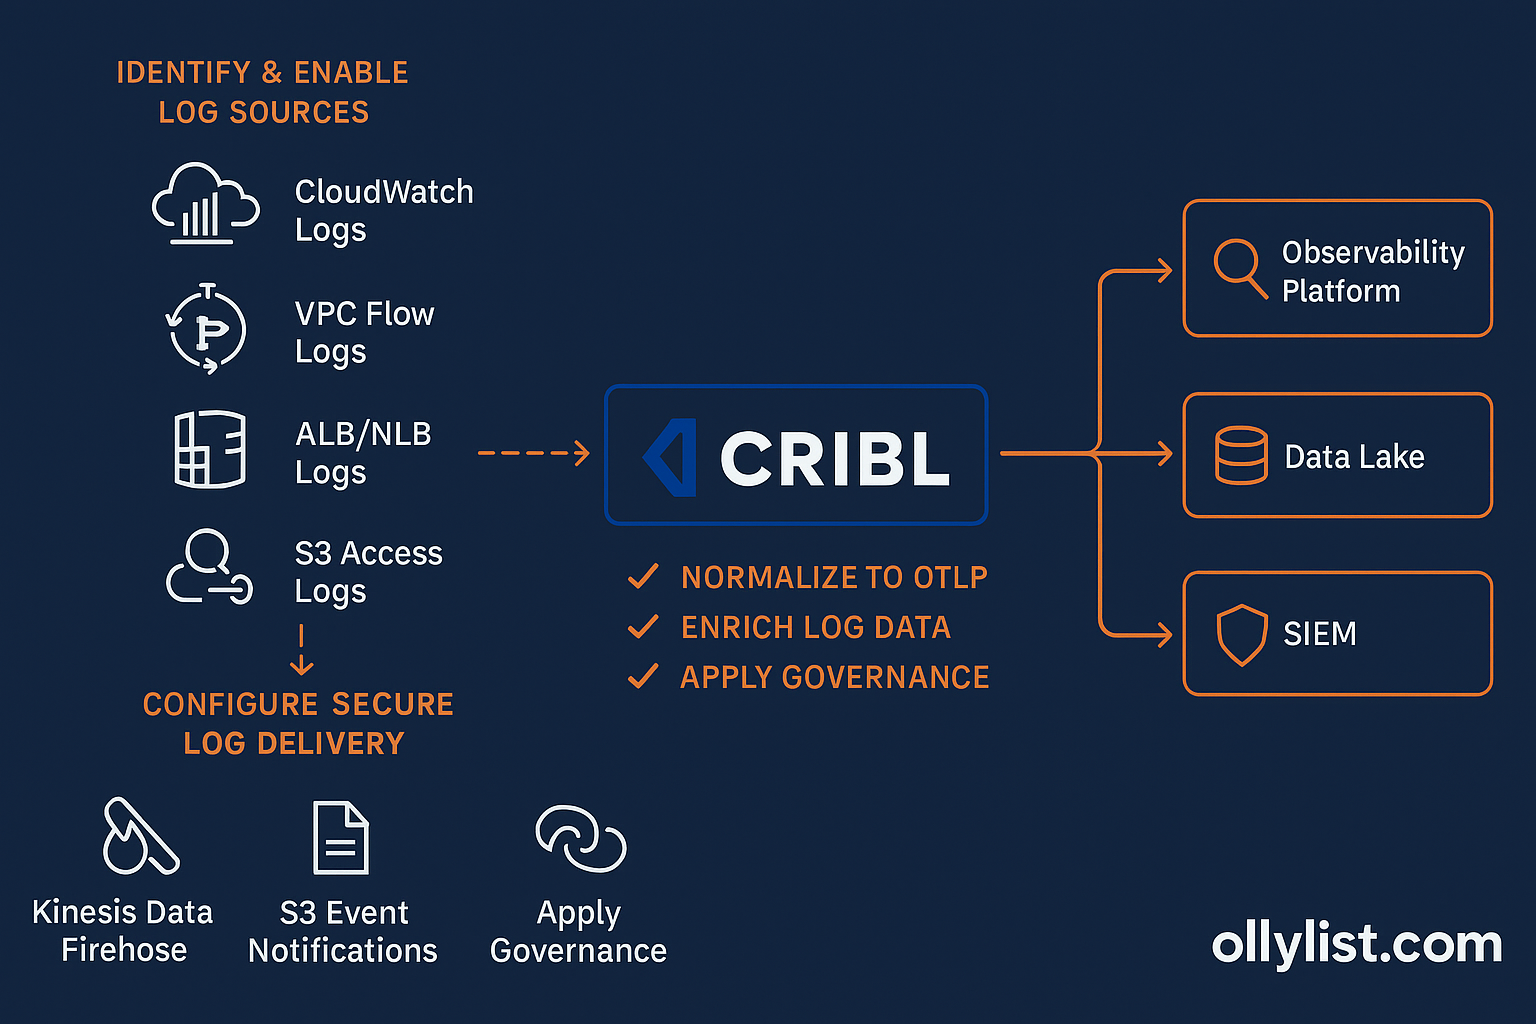
    1. Identify and Enable Required Log Sources

    • CloudWatch Logs: Application logs, Lambda logs, system logs.
    • VPC Flow Logs: Network traffic patterns and security monitoring.
    • ALB/NLB Logs: Load balancer access logs.
    • S3 Access Logs: Object-level activity for compliance and auditing.
    • EKS Container Logs: Via CloudWatch Container Insights or Fluent Bit.

    2. Configure Secure Log Delivery

    • Kinesis Data Firehose → Cribl:
      • Create a Kinesis Data Firehose delivery stream.
      • Use Cribl’s Kinesis input to consume events.
      • Apply IAM roles granting firehose:PutRecordBatch to source services.
    • S3 Event Notifications → Cribl:
      • Configure log service to store data in S3.
      • Enable event notifications for s3:ObjectCreated.
      • Route notifications to an SQS queue or Lambda function that pushes to Cribl.
    • Private Connectivity:
      • Use AWS PrivateLink or VPC Peering to avoid public internet egress.
      • Ensure Cribl workers have private IP reachability into AWS.

    3. Apply Pre-Extraction Controls

    • Filter unneeded logs at the source (e.g., set VPC Flow Logs to “Reject” traffic only if security-focused).
    • Tag log groups for ownership and cost tracking.
    • Set retention policies in CloudWatch/S3 to avoid unnecessary storage duplication.

    Cribl-Side Action Items

    1. Configure Inputs

    • Kinesis Input: Point to the AWS delivery stream endpoint.
    • S3 Input: Connect to S3 bucket(s) with access keys or IAM role assumption.
    • API/Cloud-Native Connectors: Use AWS CloudWatch Logs input when direct API pull is preferred.

    2. Normalize to OTLP

    • Create pipelines that:
      • Parse AWS JSON log structures.
      • Map fields to OpenTelemetry conventions (service.name, cloud.region, http.status_code).
      • Apply consistent timestamp formats (UTC, RFC3339).

    3. Enrich Log Data

    • Join against CMDB/asset inventory for system context.
    • Append environment metadata (prod, dev, staging).
    • Add geolocation data for IP fields where appropriate.

    4. Route to Multiple Destinations

    • Observability Platform: e.g., Grafana, New Relic for performance metrics.
    • Data Lake: e.g., AWS S3, Azure Data Lake for retention and BI analysis.
    • SIEM: e.g., Splunk, Sentinel for security analytics.

    5. Apply Governance and Cost Controls

    • Mask PII using Cribl function Mask() before sending to destinations.
    • Sample high-volume logs (e.g., reduce 1:10 for debug-level messages).
    • Use Cribl “Routing” to avoid sending identical data to multiple costly destinations unnecessarily.

    What to Avoid

    • Bypassing Normalization: Raw AWS logs often have inconsistent fields; skip this and you’ll break correlation in downstream tools.
    • Using Public Egress: This can create security and compliance issues; always use private connectivity.
    • One-to-One Routing: Sending everything to a single analytics platform limits flexibility; use Cribl for fan-out routing.

    Key Takeaways

    By tightly integrating AWS-native logging services with Cribl Stream:

    • You gain multi-cloud observability without sacrificing security.
    • You reduce ingestion and storage costs through in-stream optimization.
    • You future-proof your pipeline with OTLP standardization.
  • Timeline of the Telemetry Pipeline Market

    Timeline of the Telemetry Pipeline Market

    Timeline of the Telemetry Pipeline Market

    The telemetry pipeline market has evolved significantly over the past two decades, driven by the increasing complexity of enterprise IT environments, the explosion of observability data, and the demand for cost-effective and scalable log, metric, and trace processing. Below is a historical timeline highlighting key developments and the emergence of major vendors in this space.


    2007-2015: The Foundations of Log and Data Streaming Pipelines

    During this period, organizations primarily relied on monolithic log management solutions such as Splunk and the ELK Stack (Elasticsearch, Logstash, Kibana). However, the growing volume of telemetry data created demand for more scalable and efficient data pipelines.

    • 2007 – Apache Kafka Released: Originally developed at LinkedIn and later open-sourced, Kafka became a foundational event streaming platform, enabling scalable and distributed log data processing. It was widely adopted for telemetry pipelines, forming the backbone for log and metric ingestion.
    • 2010 – Logstash Released: Created as part of the ELK Stack, Logstash provided log aggregation, transformation, and shipping, setting an early standard for log pipeline architectures.
    • 2015 – Fluentd (Precursor to Fluent Bit) Gains Traction: Initially launched in 2011, Fluentd matured and gained popularity as an alternative to Logstash, offering a lightweight and flexible log processor.

    2016-2020: The Rise of Modern Telemetry Pipelines

    As organizations shifted towards cloud-native architectures, the need for scalable, efficient, and vendor-agnostic telemetry pipelines intensified. New players emerged with innovative solutions for processing logs, metrics, and traces closer to the source.

    • 2016 – Fluent Bit Released: An evolution of Fluentd, Fluent Bit was created by Treasure Data (later Calyptia) to address performance limitations. It became a lightweight, high-performance alternative for log and metric collection, particularly in Kubernetes environments.
    • 2017 – Vector by Datadog (formerly Timber.io) Released: Originally developed as an independent open-source project, Vector introduced a high-performance, Rust-based telemetry pipeline with a focus on low-latency and efficient log processing.
    • 2018 – Cribl Founded: Cribl emerged to solve the problem of observability data management at scale, introducing LogStream, a telemetry pipeline that allowed organizations to route, enrich, and reduce observability data before storage.
    • 2019 – Edge Delta Founded: Focused on edge telemetry processing, Edge Delta introduced an AI-driven approach to anomaly detection and log analytics at the source, reducing central processing costs.
    • 2019 – Mezmo (formerly LogDNA) Gains Traction: Originally launched in 2015 as LogDNA, Mezmo evolved into a full telemetry pipeline provider, offering flexible log and data routing capabilities.
    • 2020 – ObserveIQ Founded: ObserveIQ emerged as an open-source-focused observability pipeline, with capabilities aimed at simplifying telemetry collection, routing, and transformation.

    2021-Present: Consolidation, AI-driven Pipelines, and Market Maturity

    The telemetry pipeline market has entered a phase of rapid innovation, with vendors differentiating themselves through AI-driven data processing, advanced routing capabilities, and cost optimization.

    • 2021 – Calyptia Founded: Calyptia, launched by the creators of Fluent Bit, aimed to commercialize and enhance Fluent Bit’s capabilities for enterprise observability pipelines.
    • 2022 – Cribl Expands Beyond LogStream: Cribl introduced additional products, such as Edge and Search, positioning itself as a full-fledged observability pipeline provider.
    • 2023 – AI-Powered Pipelines Gain Traction: Vendors, including Edge Delta and Cribl, increasingly incorporate AI/ML-driven anomaly detection and dynamic data routing.
    • 2024 – Market Consolidation & Partnerships: Larger observability platforms (e.g., Splunk, Datadog, New Relic) begin integrating with or acquiring telemetry pipeline vendors to enhance their data processing capabilities.

    Current Market Outlook & Future Trends

    • Shift Toward AI and Autonomous Pipelines: Vendors are incorporating machine learning to automate log filtering, anomaly detection, and cost optimization.
    • Edge Processing & Decentralization: Organizations are moving towards edge-based telemetry processing to reduce cloud costs and improve performance.
    • Vendor-Agnostic Observability Pipelines: The industry is favoring open, vendor-neutral pipelines to avoid lock-in with specific observability platforms.
    • Compression & Cost Optimization: With observability data volumes skyrocketing, solutions that can reduce storage and processing costs without losing critical insights are gaining adoption.

    Conclusion

    The telemetry pipeline market has evolved from simple log shippers to sophisticated, AI-driven observability pipelines that optimize cost, performance, and scalability. The competition among Cribl, Vector, Fluent Bit, Edge Delta, Mezmo, Calyptia, ObserveIQ, and Apache Kafka reflects a broader industry shift towards smarter and more efficient data processing. As enterprises continue to scale their observability strategies, the demand for flexible, cost-effective, and intelligent telemetry pipelines will only grow.